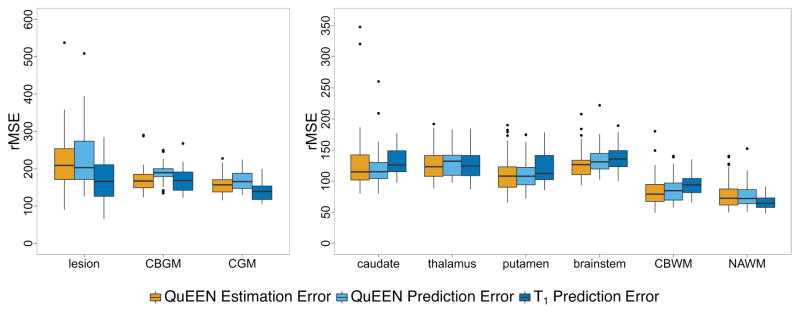
Figure C.3.
For each tissue class, boxplots of the QuEEN estimation error (shown in orange), QuEEN prediction error (shown in light blue), and T1 prediction error (shown in dark blue), using the full dataset. Each error rate is summarized as the CV-rMSE over all voxels in the eroded mask of each tissue class for a single subject. The boxplots of QuEEN estimation error show the distribution over all subjects, while the boxplots of QuEEN and T1 prediction error show the distribution over those subjects who received a second scan. We see more outliers compared with Figure 3, but the relationship between the error rates in each tissue class remains relatively unchanged.

