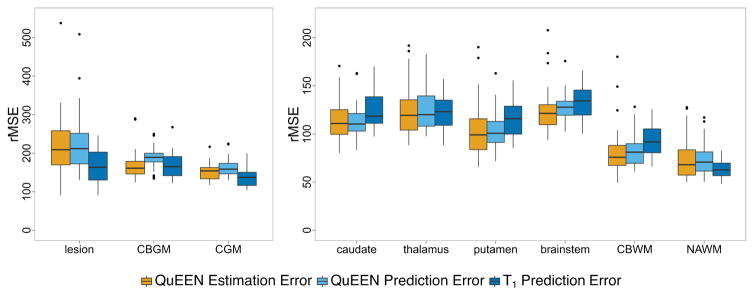
Figure 5.
For each tissue class, boxplots of the QuEEN estimation error (shown in orange), QuEEN prediction error (shown in light blue), and T1 prediction error (shown in dark blue). Each error rate is summarized as the CV-rMSE over all voxels in the eroded mask of each tissue class for a single subject. The boxplots of QuEEN estimation error show the distribution over all subjects in the high-quality dataset, while the boxplots of QuEEN and T1 prediction errors show the distribution over those subjects in the high-quality dataset who received a second scan. The reproducibility of QuEEN and T1 maps appear quite similar overall, with differences within certain tissue classes.

