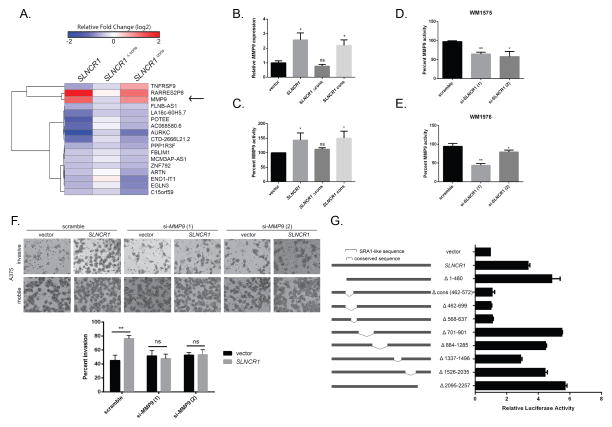
Figure 3. SLNCR1 increases melanoma invasion by transcriptionally upregulating MMP9.
(A) Heat map of differentially expressed genes significantly regulated by SLNCR1 and SLNCR1cons, but not SLNCR1Δcons, in the melanoma cell line A375. The shading represents the log2 fold change compared vector only control. (B) Relative MMP9 expression in A375 cells transfected with the indicated plasmids. RT-qPCR data is represented as the fold change compared to a vector control, normalized to GAPDH. Error bars represent standard deviations calculated from 3 reactions. (C–E) MMP9 activity from supernatants of cells transfected with the indicated plasmids or siRNAs were quantified using gelatin zymography. Percent MMP9 activity is represented as fold change compared to the vector or scramble control, normalized to MMP2 activity. Error bars represent standard deviations from three independent replicates. (C) Percent MMP9 activity in supernatants of A375 cells transfected with the indicated plasmids. (D) Percent MMP9 activity of WM1976 supernatant upon knockdown of SLNCR1. (E) Percent MMP9 activity of WM1575 supernatant upon knockdown of SLNCR1. (F) Matrigel invasion assay of A375 melanoma cells transfected with the indicated plasmids and siRNAs, as in Figure 2 (B–D). (G) A375 cells, grown in steroid-deprived conditions, were transfected with a MMP9p-firefly (FL) reporter plasmid, a CMV-RL (renilla luciferase) control, and the indicated SLNCR1 expression plasmids. Luciferase activity was measured 24 hours post-transfection. Relative FL activity was calculated as a fold-change compared to vector only control cells, after normalization to RL activity. Shown is one representative assay from at least three independent replicates. Error bars represent standard deviation from four reactions. Significance was calculated using the Student’s t-test: * p-value < 0.05, ** p-value < 0.005, *** p-value < 0.0005, ns = not significant. See also Figure S3.

