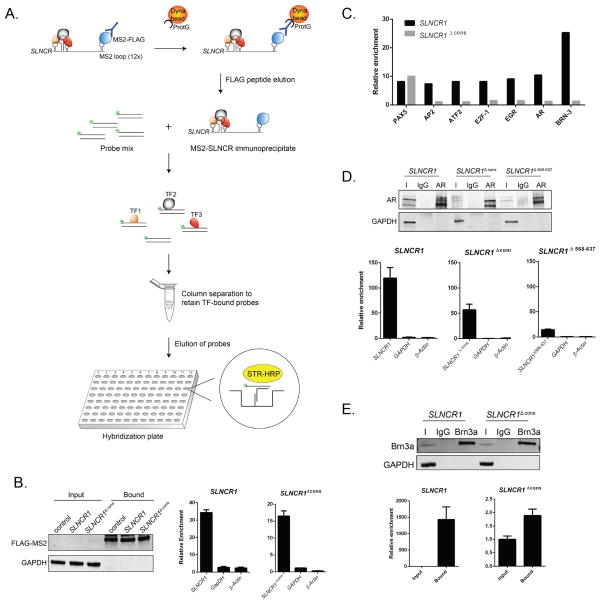
Figure 4. AR and Brn3a bind to adjacent SLNCR1 sequences.
(A) Schematic presentation of the RATA method for identifying TFs associated with SLNCR1. SLNCR1-MS2 RNP complexes were immunoprecipitated with α-FLAG antibody, eluted from beads using FLAG peptide, and the eluate was immediately subjected to the TF Activation Profiling Plate Array I (Signosis). TF-bound probes were isolated through column separation and analyzed through hybridization with a plate whose wells are pre-coated with complementary DNA. (B) Ectopically expressed FLAG-tagged MS2 was immunoprecipitated from A375 cells transfected with the indicated MS2-loop containing SLNCR1 construct, compared to control cells expressing untagged SLNCR1 constructs. Left panel: total protein input or bound proteins following IP with α-FLAG antibody was subjected to Western blot analysis. The blot was probed with α-FLAG and α-GAPDH antibodies. Middle and right: relative enrichment of the indicated transcripts as measured by RT-qPCR compared to RNA enriched from cells expressing SLNCR1 without MS2 stem loops. Bound FLAG-MS2 RNPs were eluted using FLAG peptide. (C) Fold enrichment of TF-specific probes with MS2-based purification of SLNCR1 or SLNCR1Δcons from A375 cells. Probe enrichment is represents fold enrichment compared to an untagged RNA control IP, after normalization to the signal of GATA-specific probes. Shown is one representative assay of TF-specific probes showing significant (>7-fold) enrichment in at least two out of three replicates. (D) Immunoprecipitations from HEK293T transfected with GFP-tagged AR and the indicated SLNCR1 expressing plasmids using either α-AR antibody or an IgG nonspecific control. Top panel: western blot analysis of input (I), IgG bound (IgG) or α-AR bound (AR) proteins. Bottom panels: relative enrichment of the indicated transcripts from AR-IPs, compared to an IgG nonspecific control. HEK293T cells were transfected with GFP-tagged AR and either SLNCR1 (bottom left panel) or SLNCR1 Δcons (bottom middle panel) or SLNCR1 Δ568-637(bottom right panel) expression plasmids. (E) Immunoprecipitations from UV-crosslinked HEK293T transfected with Brn3a and the indicated SLNCR1 expression plasmid using either anti-Brn3a antibody or an IgG nonspecific control. Top panel: western blot of input (I), IgG bound (IgG) or α-Brn3a bound (Brn3a) proteins. Bottom panels: relative enrichment of the indicated transcripts from Brn3a-IPs. HEK293T cells were transfected with Brn3a and either SLNCR1 (bottom left panel) or SLNCR1 Δcons (bottom right panel). To control for differences in the efficiency of proteinase K digestion, enrichment was calculated compared to input transcript levels after normalization to levels of the 18s RNA. All RT-qPCR are represented as mean ± SD from three replicates. See also Figure S4.

