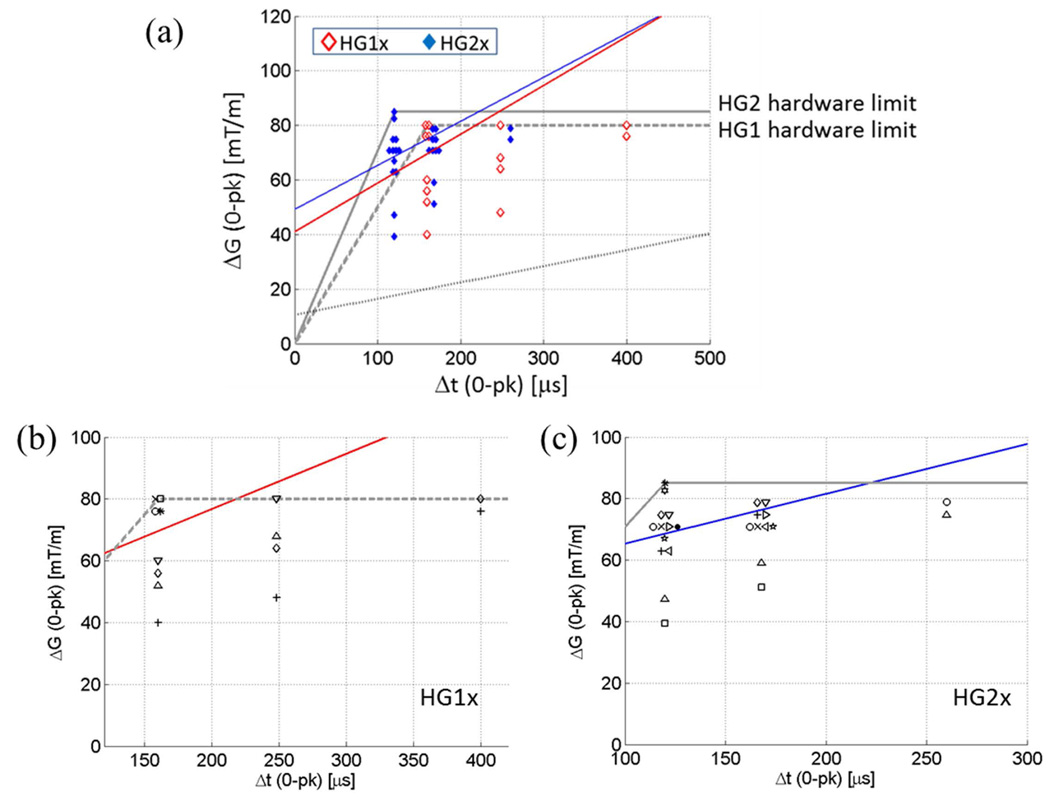
Figure 3.
(a) PNS thresholds of the X gradient coil of the head-only gradient coil sets. Markers lightly displaced in the horizontal direction indicate multiple volunteers reporting the same PNS threshold for a given rise time. Red and blue straight lines are PNS threshold curves for HG1x and HG2x, respectively, determined by logistic regression at rise-times where enough data points existed. Solid grey line, HG2 hardware limit; dashed grey line, HG1 hardware limit; dotted black line, representative whole-body gradient PNS threshold. (b) (c) Same data as in (a) plotted with distinct markers for distinct volunteers within the HG1x (b) and HG2x (c) test sessions. Same markers in (b) and (c) do not necessarily indicate the same individual.

