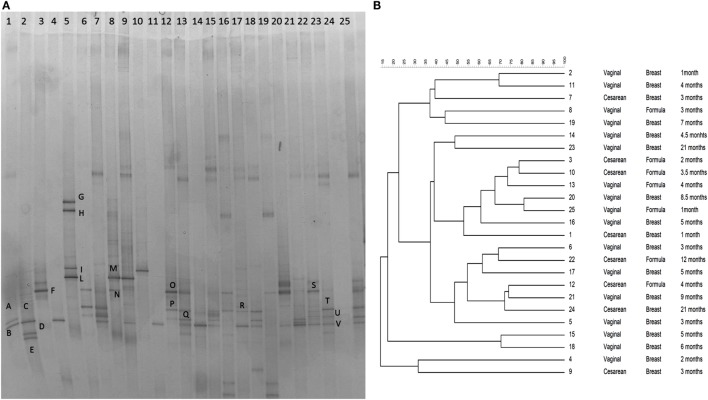
Figure 1.
(A) PCR–DGGE profiles of 25 samples obtained using the primers CcocF–GC-CcocR. Samples are ordered by age from the youngest (1 month) to the eldest (24 months of age). Bands marked with letters were subjected to sequencing after re-amplification, and the corresponding relative identities were obtained by alignment in GenBank and are listed in Table 1. (B) Dendrogram obtained from DGGE patterns by software analysis based on the Pearson’s correlation coefficient with the UPGMA algorithm. Columns indicate the delivery mode, the feeding type, and the age of samples.

