
Figure 3.
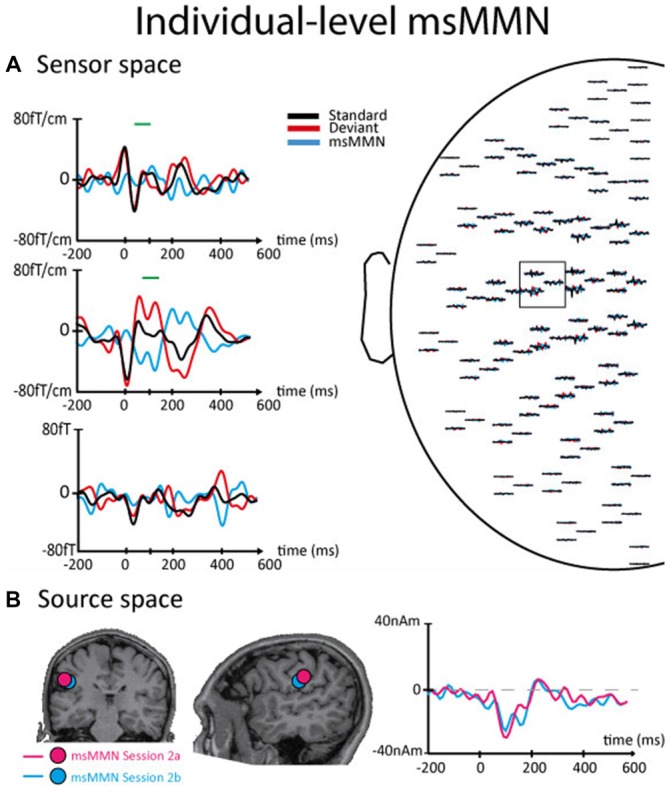
Results of the msMMN obtained in the sensor and the source spaces for a typical subject in session 2a (standards and deviants similar as in session 1) and 2b (standards and deviants were flipped compared to sessions 1 and 2a). (A) Results obtained at the sensor level for session 2b. Please, refer to the legend of Figure 2 for more information about this part of the figure. (B) Left and Middle. Coronal (left) and sagittal (middle) slices of the brain showing the location of the ECDs that best explains the cortical generator of the msMMN in sessions 2a (pink dot) and 2b (blue dot). Right. Superposition of msMMN waveforms corresponding to sessions 2a (pink line) and 2b (blue line).