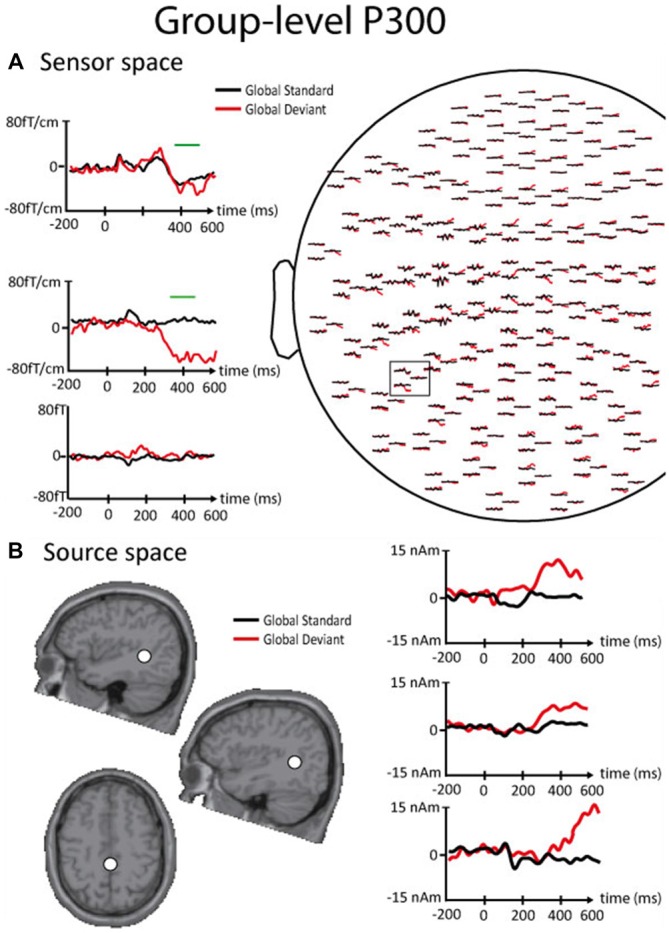
Figure 4.

Results of the P300 response obtained in the sensor and the source spaces at the group level. (A) Right. Left part of the MEG sensor array viewed from top. Left. Enlarged orthogonal planar gradiometers (Top, Middle) and magnetometer (Bottom) signals showing evoked magnetic responses corresponding to global standards (black line) and global deviants (red line). The green lines indicate the timing of significant differences between standards and deviants disclosed by non-parametric cluster-based statistics performed at the sensor level. (B) Right. Source waveforms corresponding to global standards (black line) and global deviants (red line) for the different sources (Top, left temporo-parietal junction (TPJ); Middle, right TPJ, Bottom, supplementary motor area (SMA)). Left. Locations of the ECDs (white dot) that best explain the magnetic field pattern corresponding to the P300 response. Top. Sagittal slice of the left hemisphere. Middle. Sagittal slice of the right hemisphere. Bottom. Axial slice presented in the neurological convention.
