FIGURE 2.

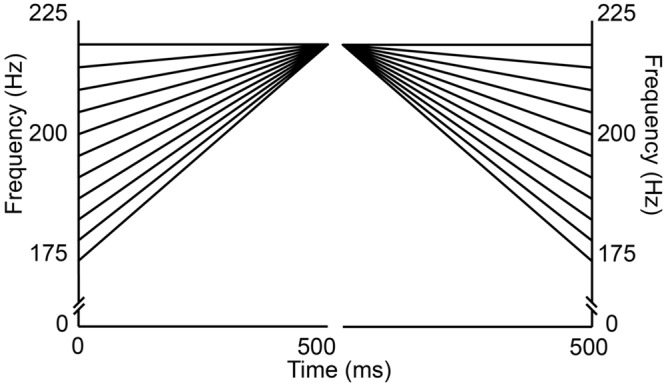
Frequency (y-axis) and time (x-axis) chart for the pitch continua. The left side depicts the 11 individual steps for the rising tone; the right side each step for the falling tone.

Frequency (y-axis) and time (x-axis) chart for the pitch continua. The left side depicts the 11 individual steps for the rising tone; the right side each step for the falling tone.