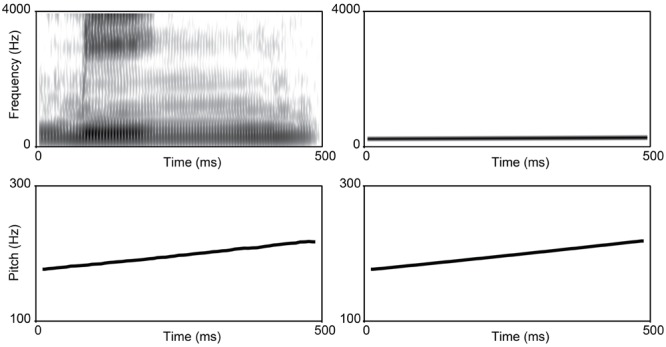
FIGURE 3.

Comparison of speech (left) vs. music (right) stimuli. The top left box displays a broadband spectrogram of step 1 from the rising continuum for speech; the top right box displays a narrowband spectrogram of step 1 for music. The bottom panels display the corresponding pitch contours of the F0 for speech (left) and music (right). All frequencies are displayed in Hz.
