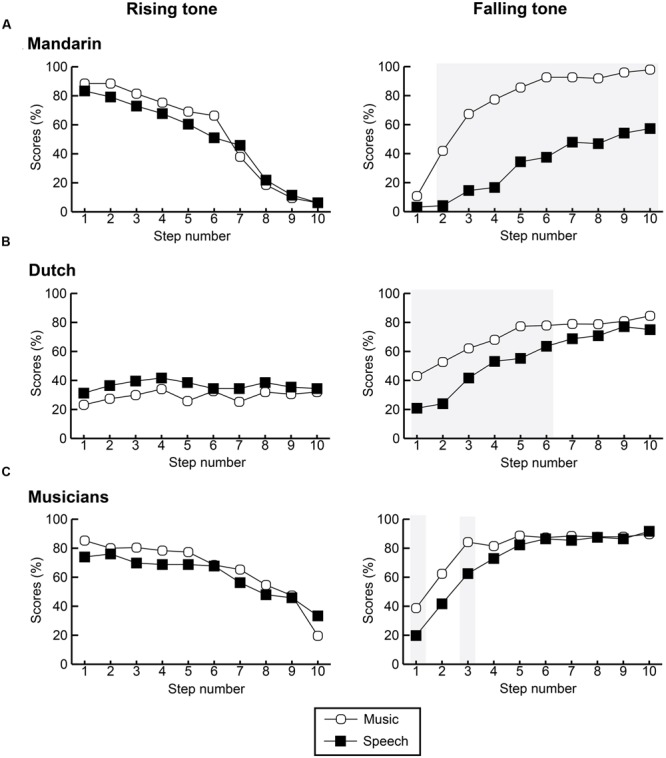
FIGURE 5.

Identification curves per step in each pitch continuum comparing between participant group and conditions for Mandarin participants (A), Dutch non-musician participants (B), and Dutch musicians (C). Left side illustrates rising tones in speech and music; right side contains values for falling tones. Gray shaded areas indicate significant differences between contexts per step.
