Figure 4.

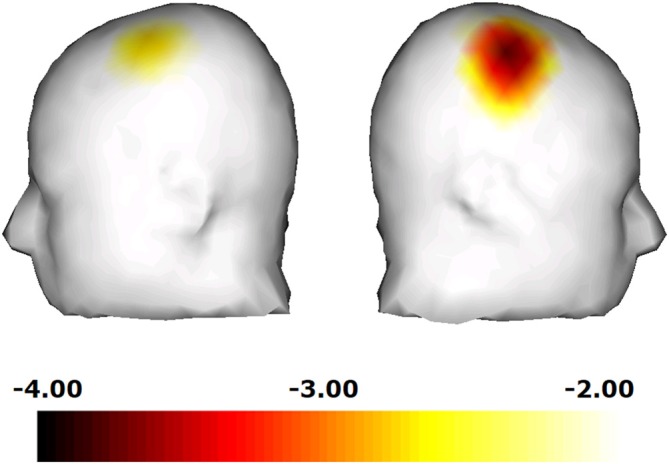
Comparison for each electrode site, and plotted the results in a three-dimensional t-map, demonstrating the difference between the “hand image included” and “hand image omitted” clips specifically in the right central.

Comparison for each electrode site, and plotted the results in a three-dimensional t-map, demonstrating the difference between the “hand image included” and “hand image omitted” clips specifically in the right central.