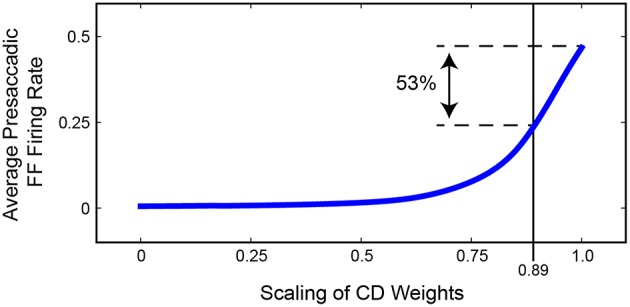
Figure 11.

Summary of the relationship between strength of FEF remapping and strength of CD in our model. Plotted is the average activity of “Future Field” (FF) neurons during the 50 ms epoch leading up to the saccade. As the weights between the SC layer and the hidden layer are decreased (to left), the average presaccadic FF activity also decreases, although non-linearly. A 53% reduction in presaccadic remapping as found by Sommer and Wurtz (2006) would correspond to a 0.89 scaling of CD weights, that is, an 11% reduction of CD strength.
