Figure 14.
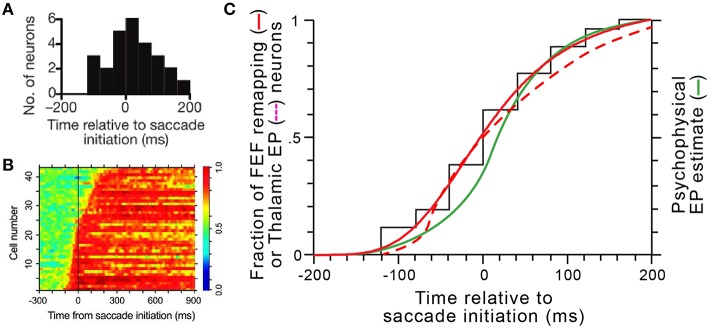
Coordinated dynamics of remapping and eye position signals in vivo. (A) The distribution of presaccadic remapping onset times for 26 FEF neurons (adapted with permission from Figure 3C of Sommer and Wurtz, 2006). (B) ROC analysis performed on 43 eye position related neurons in central thalamus (adapted with permission from Figure 5B of Tanaka, 2007). (C) Comparison of timing curves. The black “staircase” function shows the raw cumulative distribution of remapping onset times in FEF derived from panel (A), and the solid red curve shows the logistic fit to that data (equation was y = [−1.08∕(1+[(x+200)∕204.9]3.9)] + 1.08. The dashed red curve shows the cumulative distribution of updates in thalamic eye position signals derived by tracing and smoothing the transitions to red across the rows of data in panel (B). The green curve shows the time course of internal representations of eye position in humans calculated from a representative psychophysical experiment (modified with permission from Figure 4B of Honda, 1989).

