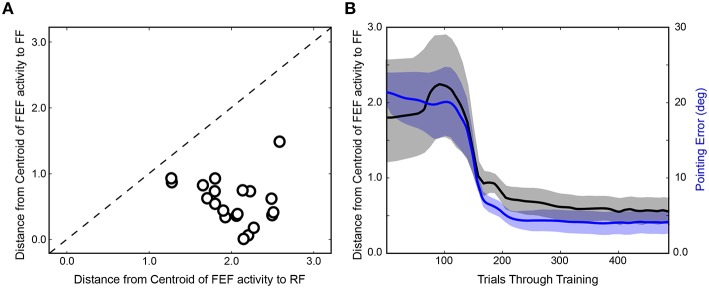
Figure 5.
Summary of training effects on FEF activity. (A) Final prevalence of presaccadic remapping in the neurons. For the FEF sheet of the trained model (400th trial) during the presaccadic period, plotted is the distance from the centroid of neural activity to the Receptive Field (RF) and Future Field (FF) locations. All points lie below the unity line, indicating that neurons representing the FF were more active than those representing the RF. (B) Correspondence between emergence of presaccadic remapping and improvement in behavior. The left ordinate is the same as for panel (A) (distance from centroid of activity to the FF location in the FEF sheet), but now this centroid location (black) is plotted across training and compared with the errors in pointing (blue; right ordinate). Each trace shows mean ± SE over the 20 training runs. On average, after about 100 trials of training, remapping began to emerge (plummeting blue curve). In synchrony, pointing errors dropped drastically.

