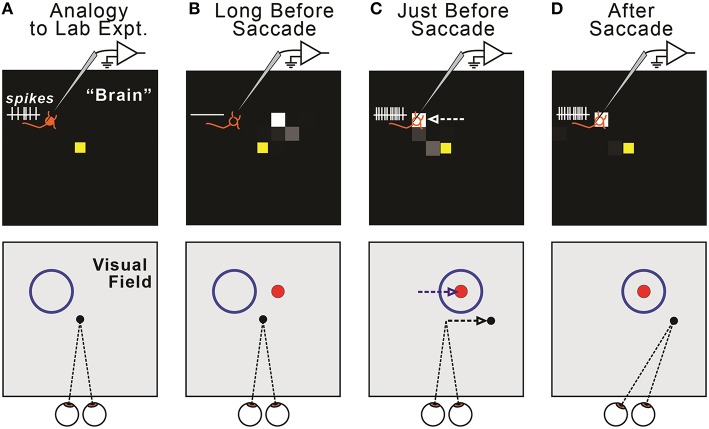
Figure 6.
Relationship between remapping of neural activity in the model (top row) and remapping of visual sensitivity in the visual field (bottom row). (A) The model displays all FEF neurons, each of which has a Receptive Field (RF). We quantify changes in the locus of activity across the sheet (“neural remapping”). In contrast, neurophysiologists typically record a single neuron and quantify changes in its visual sensitivity across the visual field (“receptive field remapping”). The one-to-one correspondence between neural and receptive field remapping may not be obvious. It helps to imagine recording from a single neuron in the modeled “brain” (top) as a monkey makes fixations and saccades (bottom). Due to our sheet topography, a neuron located up-left in the sheet (top, orange “neuron” icon) has a receptive field up-left from the point of fixation (bottom, blue circle). (B) Long before a saccade, the recorded neuron exhibits no activity (top), because the visual stimulus (red ball, shown as a dot) is outside of its classical RF (bottom). (C) Just before a rightward saccade, the centroid of active neurons shifts leftward on the FEF map (top, white arrow). A physiologist would observe that the “recorded” neuron now responds to the red ball stimulus; that is, its visual sensitivity has shifted rightward (bottom, blue arrow), parallel to the upcoming saccade vector (bottom, black arrow). In general, in our model, presaccadic remapping of neurons on the FEF sheet implies oppositely directed presaccadic remapping of visual sensitivity in the visual field. (D) After the eye moves, the subject fixates a new location, and the neuron's visual sensitivity is now back at its classical receptive field.

