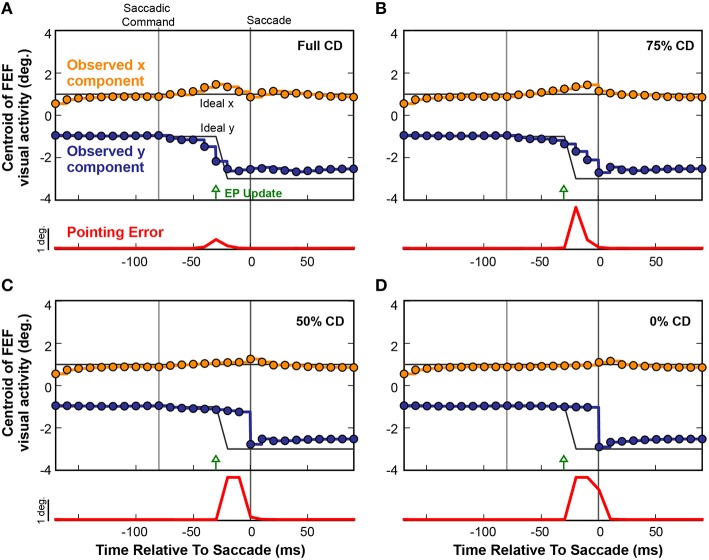
Figure 9.
Four repetitions of a single trial as CD was reduced from (A) fully intact CD, to (B) 75%, (C) 50%, and (D) 0% of the intact level. Each circle represents the centroid of FEF activity (x component, orange; y component, blue) at each refresh of the FEF layer (every 10 ms). Activity between the updates is shown by same-colored lines. The black lines denote the ideal movement of the centroid with this saccade-stimulus configuration, such that the error in BC coordinates would stay at zero and arm pointing would be continuously accurate despite the saccade. The red trace shows errors in pointing at each time point. As the CD pathway was silenced in successive trials from 100% (normal) to 0% (full shutoff), i.e., from panels (A–D), the remapping became more gradual and started later. Even with just 50% reduction in CD strength (C), the presaccadic remapping disappeared and the error in the network, and thus in pointing (localization of the stimulus), became large.

