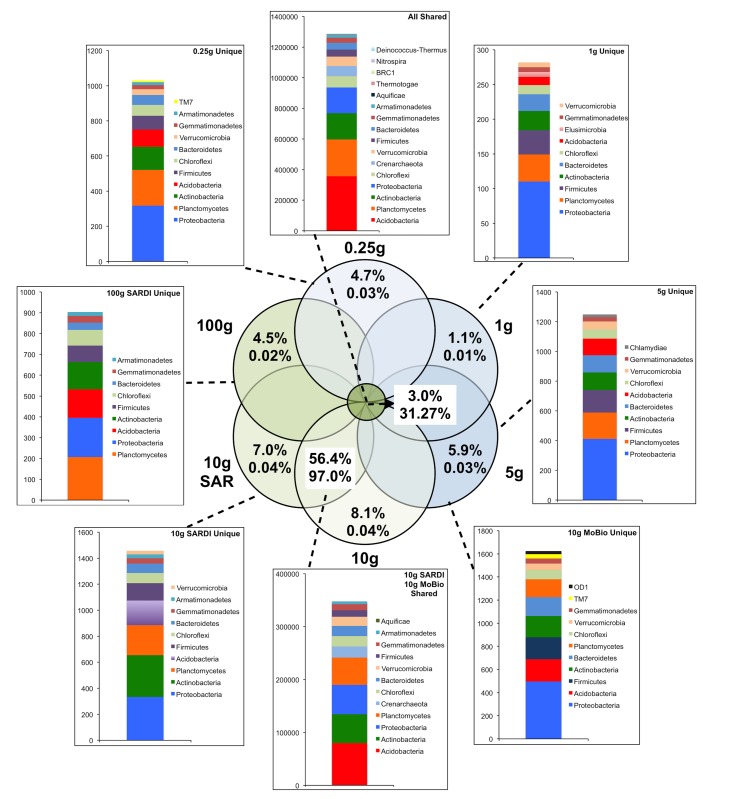
FIGURE 2.
Sequence abundances of the top most abundant unique OTUs for each sample size and their corresponding classification for the bacterial 16S rRNA gene sequences. OTUs that were shared among all sample sizes are shown in the “All Shared” inset with those shared between the SARDI 10 g and MoBIO 10 g in an additional inset. Within the Venn diagram, top numbers indicate the percent of total OTUs while the bottom represents the percent of total sequences.

