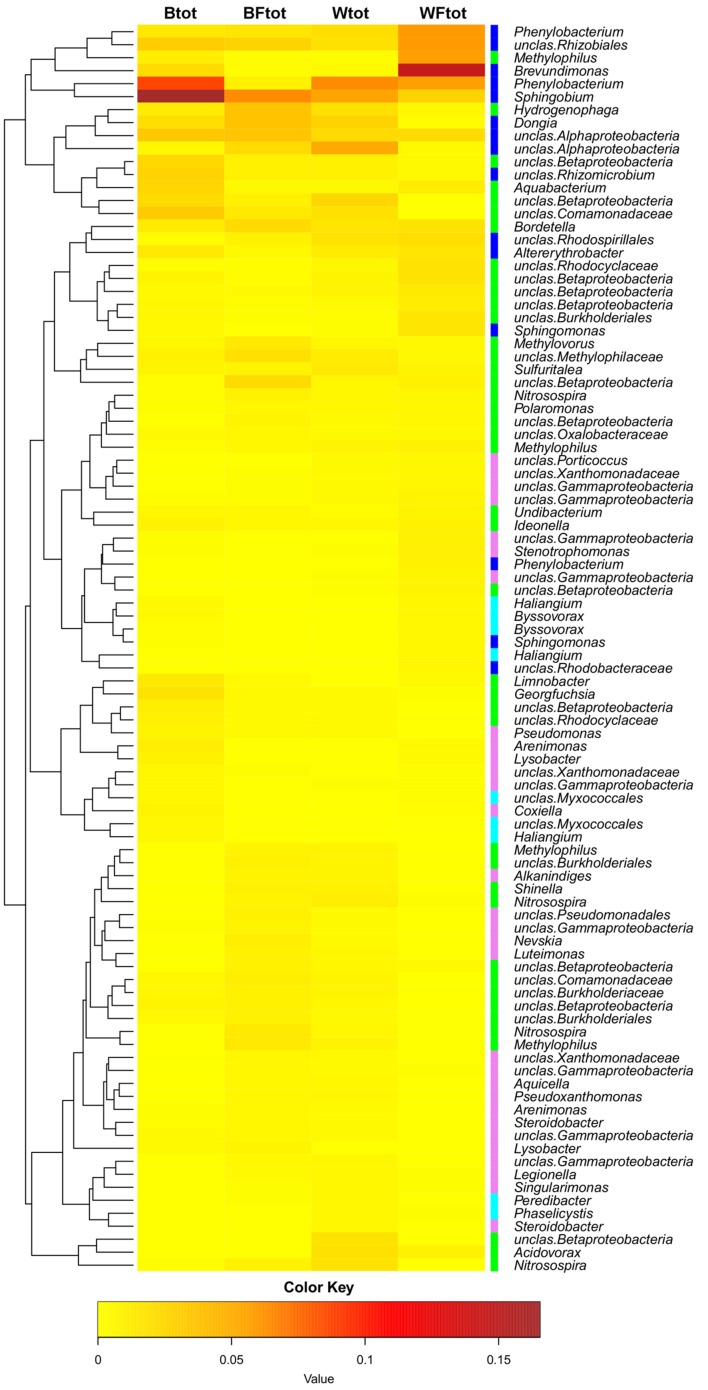
FIGURE 4.
Heatmap showing the OTUs from the total soil bacterial community that are responsible for differences seen between samples (as determined by metastats). Only OTUs with abundance ≥0.5% at least in one total community sample are shown. The colors ranging from yellow to brown indicate the gradient in abundance of the OTU. Colors affiliated with the taxa represent the following classes: Alphaproteobacteria in blue, Betaproteobacteria in green, Gammaproteobacteria in pink, Deltaproteobacteria in cyan. The dendrogram shows which OTUs occur more often together.

