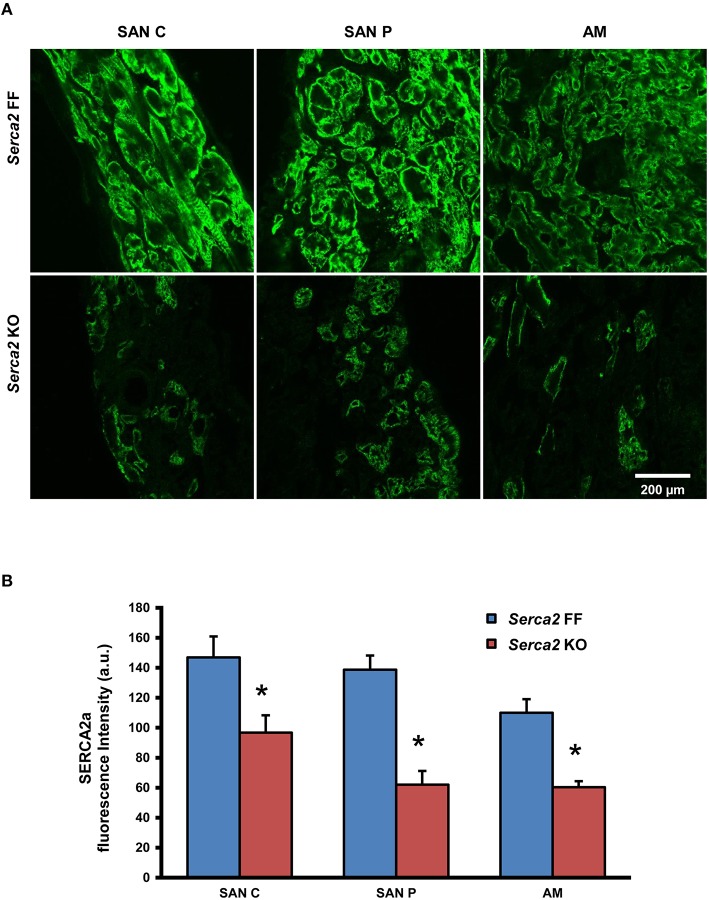
Figure 7.
SERCA2a protein expression in the right atrium and sinus node. (A) Representative high magnification images showing SERCA2 labeling (green signal) in the sinus node center (SAN C), sinus node periphery (SAN P) and atrial muscle (AM) of Serca2 FF (top row) and Serca2 KO (bottom row) right atrial tissue sections. (B) SERCA2a fluorescence intensity in the sinus node center (SAN C), sinus node periphery (SAN P) and atrial muscle (AM) of Serca2 FF (blue bars) and Serca2 KO (red bars) tissue sections. * denotes P < 0.05 vs. corresponding Serca2 FF tissue values.

