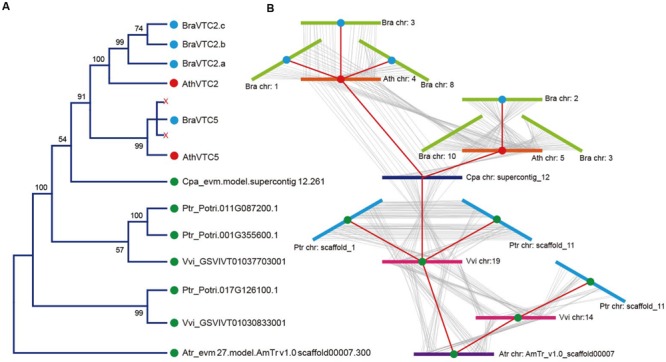
FIGURE 2.

Microsynteny analysis of the GGP genes in representative eudicots. The following parts are shown from left to right. (A) Protein maximum likelihood (ML) tree: The tree was constructed by ML, and bootstrap values were calculated with 1,000 replications. The protein sequences used for the tree were listed in Supplementary Table S7. (B) Microsynteny analysis: the microsynteny of the GGPs in A. thaliana, A. trichopoda, C. papaya, P. trichocarpa, V. vinifera and B. rapa was evaluated with the CoGe comparative genomic tool (see in Supplementary Table S5) and indicated a possible GGP collinear relationship. BraVTC2 retained three copies and BraVTC5 lost two copies during fractionation.
