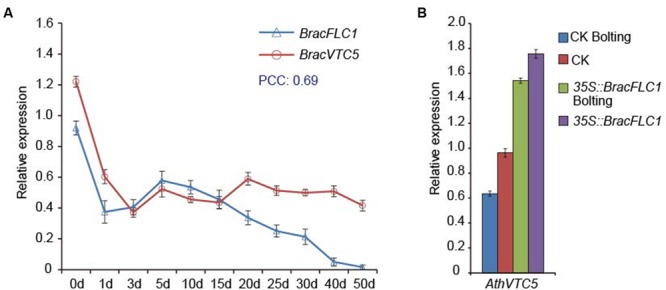
FIGURE 3.

Regulatory relationships between the VTC5 and FLC genes based on their expression patterns. (A) Expression patterns of BracVTC5 and BracFLC1 in Brassica leaves under simulated vernalization for 50 days. PCC indicates the Pearson’s correlation coefficients of the gene pairs using the transformed qRT-PCR data. (B) Expression of AthVTC5 in T2 BracFLC1 transgenic and CK Arabidopsis leaves. The transgenic Arabidopsis plants were 4 weeks old (vegetative) and 7 weeks old (bolting) and the CK plants were 4 weeks old (vegetative) and 6 weeks old (bolting). The T2 BracFLC1 transgenic plants were from the study by Liu et al. (2012). The error bars (A,B) represent the standard errors from three independent replicates.
