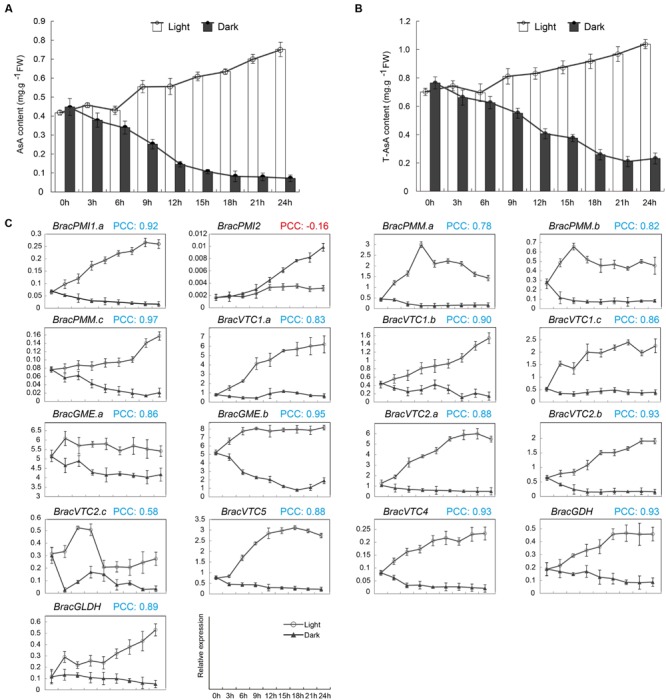
FIGURE 4.

Effects of light on the AsA levels and the expression of enzymes in the AsA biosynthetic pathway in Brassica crop NHCC leaves. Five-leaf stage NHCC plants grown under 16 h of light and 8 h of darkness were moved into the dark or exposed to continuous light. The analysis started after 8 h of darkness (corresponding to the time of the beginning of the light period), as detailed in the Materials and methods. The leaves were extracted at the indicated times and assayed to determine the AsA, T-AsA and corresponding gene expression levels. (A) AsA and (B) T-AsA levels. (C) Transcript levels of enzymes of the AsA D-Man/L-Gal pathway. For each sample, the transcript levels were normalized to those of actin (control). PCC indicates the Pearson’s correlation coefficients between each light/dark-inducible gene using the transformed qRT-PCR data and the corresponding AsA content. The PCCs were considered significant at the 0.05 significance level (p-value). The data shown in (A–C) are the mean values ± SD of three individual experiments (n = 3).
