
Figure 1.
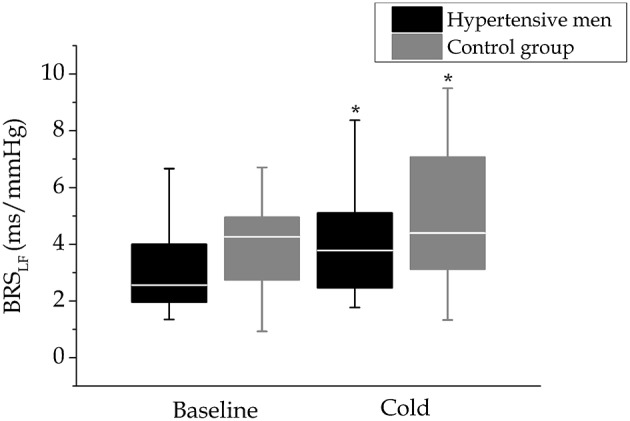
Baroreflex sensitivity in cold. Baroreflex sensitivity before (baseline) and at the end of the cold exposure in hypertensive men (n = 24) and control group (n = 17) depicted with boxplot figures. Baroreflex sensitivity level and changes in cold did not differ between the study groups. *p < 0.05 vs. baseline (time).