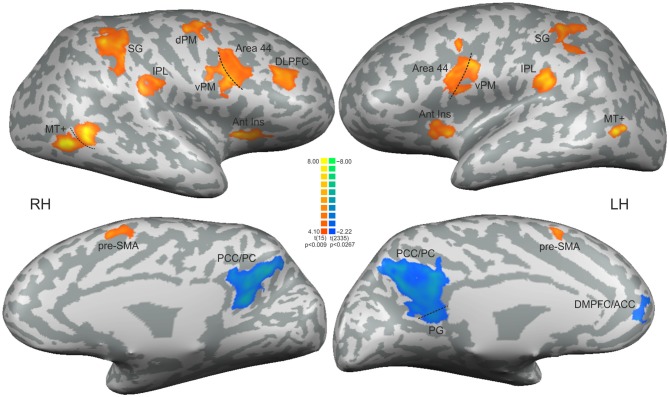
Figure 3.
Statistical significant clusters associated with the contrast [non-periodic > periodic] (orange-yellow scale) and the contrast [non-periodic < periodic] (blue-green scale). All clusters are listed in Table 1. The statistical maps are projected onto a 3D surface rendering of the standard normalized brain of one subject. DLPFC, dorsolateral prefrontal cortex; Ant Ins, anterior insula; vPM, ventral premotor area; dPM, dorsal premotor area; IPL, inferior parietal lobule; SG, supramarginal gyrus; MT+, middle temporal region; pre-SMA, presupplementary motor area; PCC/PC, posterior cingulate cortex/precuneus; PG, parahippocampal gyrus; DMPFC/ACC, dorsomedial prefrontal cortex/anterior cingulate cortex. RH, right hemisphere; LH, left hemisphere.

