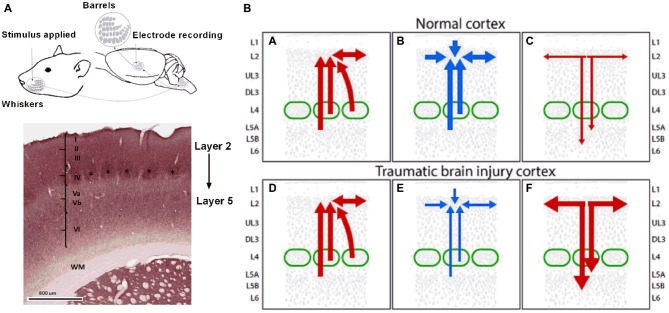
Figure 3.
Putative alterations in inhibitory circuits in supragranular layers 2/3 following the long term after diffuse TBI. Panel (A) on the left shows a schematic representation of the rat whisker tactile system and electrophysiology recording from the barrel cortex. Evoked extracellular neuronal responses were recorded from the somatosensory barrel cortical layers 2–5 in response to whisker stimulation. Note the cluster of cells or barrels as denoted by “*” in cortical layer 4. Panel (B) on the right shows hyperexcitation in the supragranular layer 2 and Upper 3 in the long term after diffuse TBI resulting from either reduced local L2/U3 inhibitory inputs or due to a loss of excitatory drive from L2/U3 to deeper infrangranular layers which feed inhibition from L5 to L2/3. Top Row: all panels show circuitry in normal cortex, Lower Row: all panels show circuitry in TBI cortex. Left Panels (A,D) show excitatory inputs (in red) to L2/3 from local L2/3, L4 and L5 excitatory pyramidal neurons within and neighboring cortical columns. Panel (B) shows inhibitory inputs (in blue) to L2/3 from local L2/3 inhibitory neurons, input layer L4 and deeper L5. Panel (E) shows diminished inhibitory input as represented by the thinner blue lines and arrows to L2/3 from L2/3, L4 and L5 in the TBI cortex resulting in hyperexcitabilty in L2 and U3. Right panels show excitatory outflow in normal (C) and hyperexcitable TBI cortex as represented by thicker red lines and arrows (F). Figure details based on information in Xu and Callaway (2009) and Petersen and Crochet (2013).

