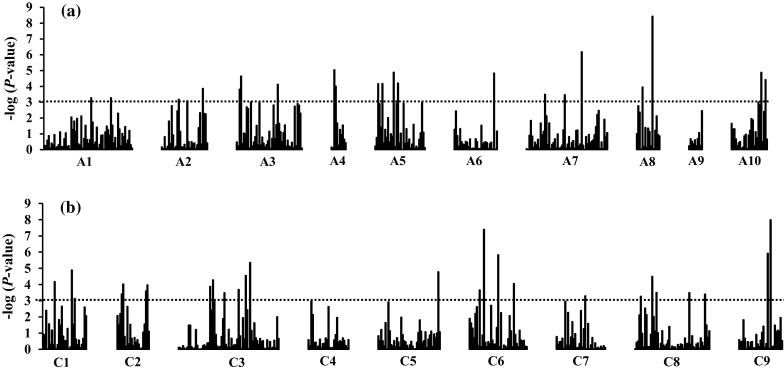
Fig. 3.

Graphic representation of negative log P values of SSR loci in B. napus associated with partial resistance to S. sclerotiorum by chromosome in the A and C genomes. The dotted line is the significance threshold level of P < 0.001 used to declare SSR loci significant in association mapping using the GLM + Q model. a Genome AA, b genome CC.
