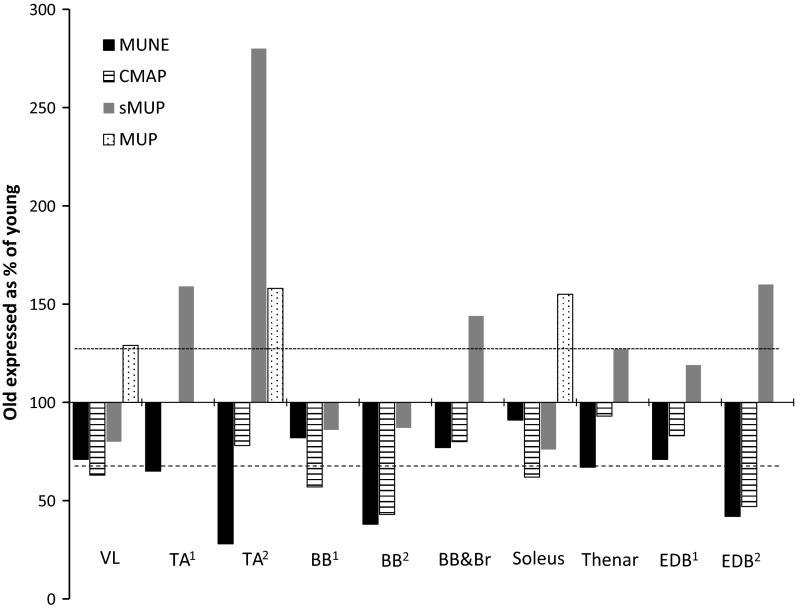
Fig. 2.
MUNE values, CMAP, sMUP and MUP values in old compared with young. The dashed horizontal line indicates the median MUNE in old and the dotted horizontal line indicates the median MUP or sMUP in old expressed as % of young from the various studies. Where multiple older age groups or contraction intensities were reported in a single study, the age range 60–80 years and closest intensity to 25 % MVC were used in this figure. TA Tibialis anterior, BB biceps brachii, BB&Br biceps brachii and brachialis, EDB extensor digitorum brevis. Data are from: VL (Piasecki et al. 2015) TA1 (Power et al. 2010); TA2 (Hourigan et al. 2015); TA3 (Dalton et al. 2008); BB1 (Galea 1996); BB2 (Power et al. 2012); BB&Br (Brown et al. 1988); Soleus (Dalton et al. 2008); Thenar (Galea 1996); EDB1 (Galea 1996) and EDB2 (Campbell et al. 1973)

