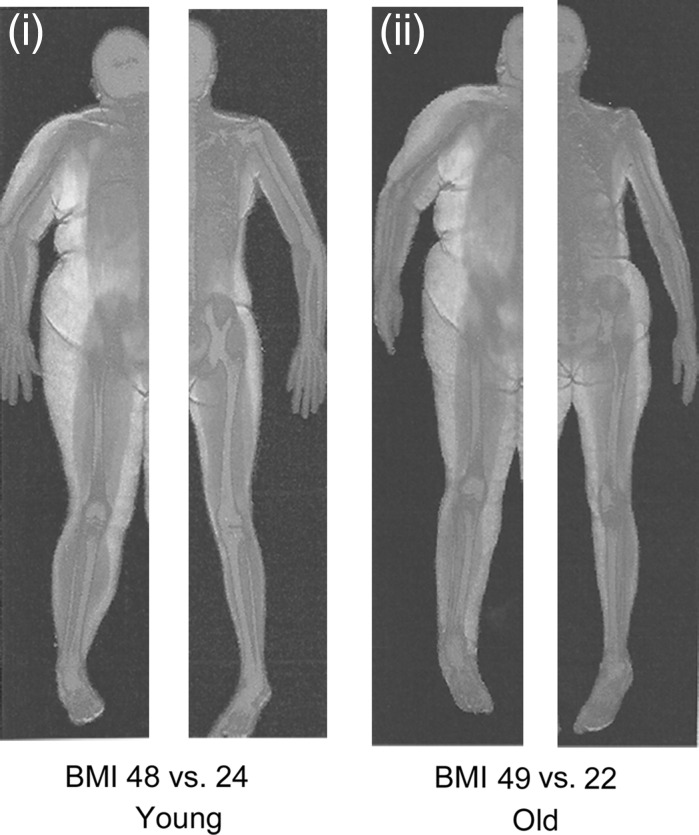
Fig. 1.
Representative DEXA scans taken from Tomlinson et al. (2014b) of a (i) young obese female versus young normal weight female and (ii) old obese female versus old normal weight female. Colour key: blue for bone, red for lean tissue, yellow for adipose tissue. (Color figure online)

