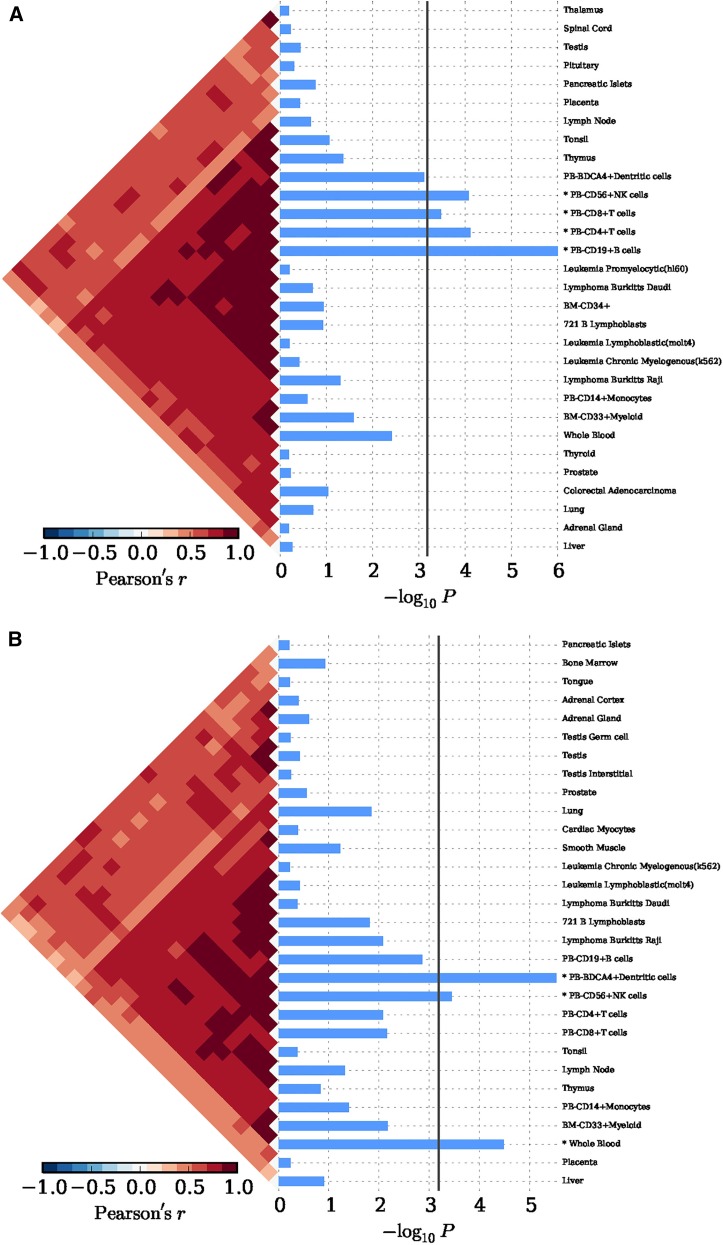
Figure 3.
The tissue enrichment of SLE implicated genes with 79 tissues expression matrix in H. sapiens. (A) Tissue enrichment by 63 SNPs in an Eastern Asian population. (B) Tissue enrichment by 118 SNPs in a Caucasian population. The bottom indicates the log transformed P value. The vertical line indicated the Bonferroni-corrected significance criteria (P ≤ 6.33 × 10⁻⁴). The tissues names are listed in the right.

