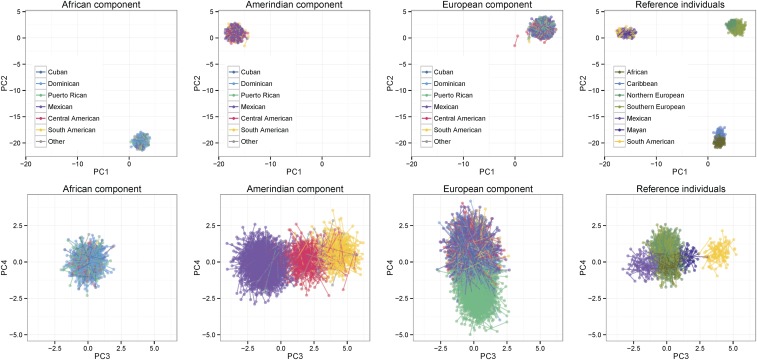
Figure 5.
Worldwide ancestry-specific PCs. The top row shows PCs 1 and 2, while the bottom row shows PCs 3 and 4, as outlined in Figure 1B. The first three columns show the three ancestral components of the admixed individuals, while the fourth column shows the reference individuals. The values in the four columns were calculated together and may be compared, but are shown in separate plots for clarity. The two haplotypes from each individual are connected by a line. The legend in the first three columns indicates color-coding for the self-identified background groups of HCHS/SOL participants, while that in the fourth column indicates regional origin of reference individuals. HCHS/SOL, Hispanic Community Health Study/Study of Latinos; PCs, principal components.

