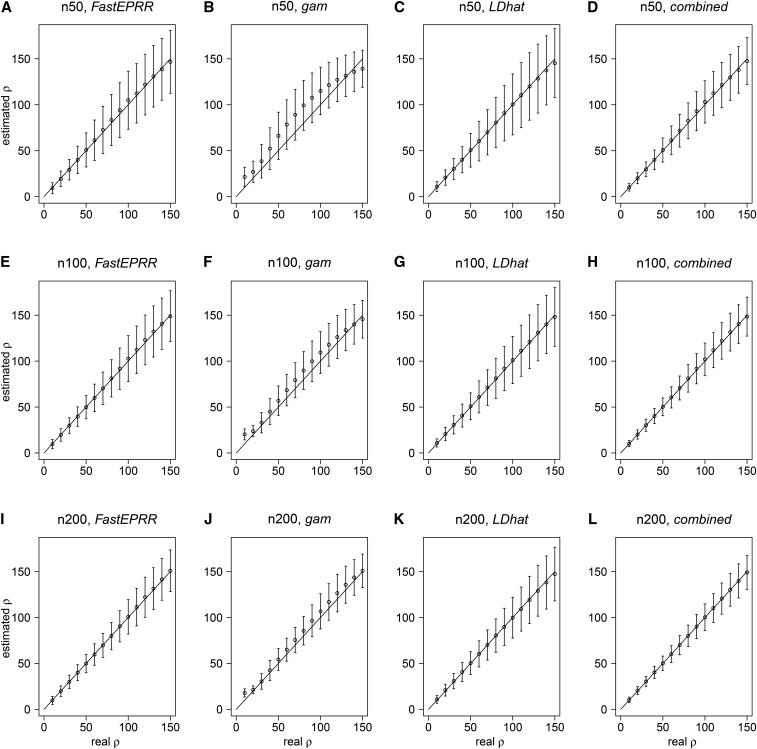
Figure 1.
Comparison of , , , and . We compared (A), (E), and (I) with (B), (F), and (J), (C), (G), and (K), and (D), (H), and (L), with the sample sizes of (A)–(D), (E)–(H) and (I)–(L). The number of segregating sites (when ), (when ), and (when ). The mean and the SD of were estimated using simulated data conditional on and , unless noted otherwise.

