Figure 7.
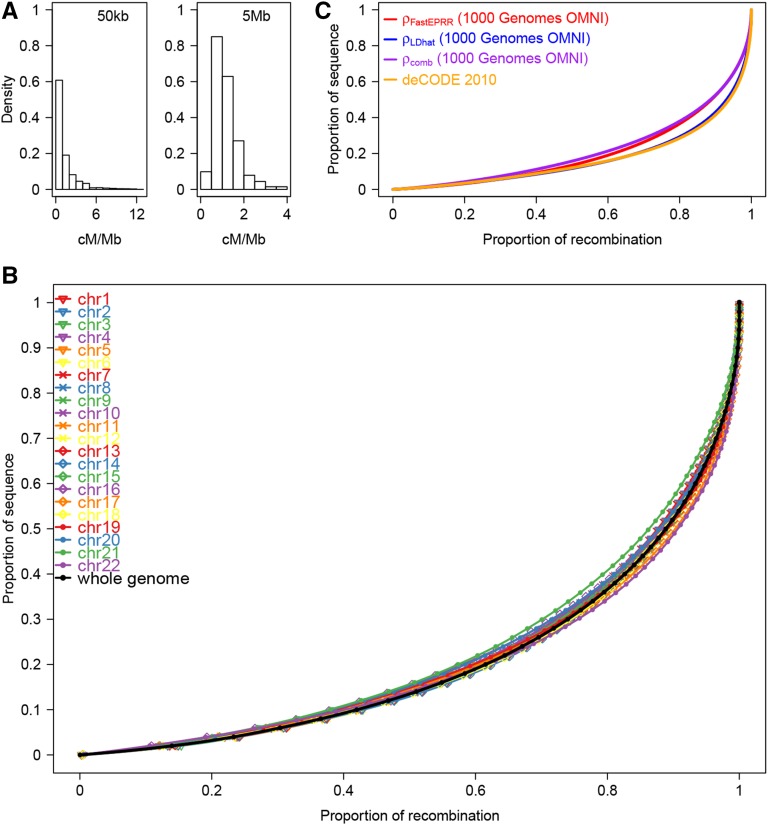
Recombination rate in the African population (YRI). (A) Histograms of the recombination rate for the whole autosomal genome at 50-kb and 5-Mb scales, respectively. (B) Proportion of recombination in different fractions of the sequence. Each colored line represents one chromosome, while the black line denotes the whole autosomal genome. (C) Concentration of recombination in a small proportion for the four genetic maps.

