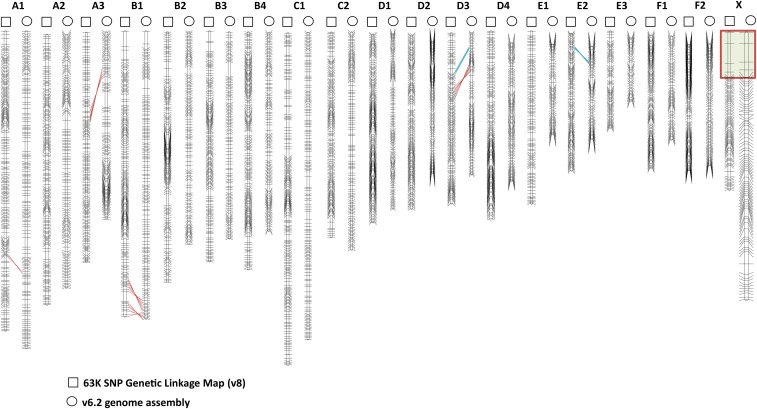
Figure 1.
Domestic cat SNP linkage map (indicated above by squares) comparison with the v6.2 genome assembly (indicated above by circles). Black horizontal lines indicate framework marker (LOD 3.0) positions on both maps. Discordant marker orders are displayed between the maps with red (inversions) and blue (translocations) lines. The red box on the X chromosome maps indicate the pseudoautosomal region markers. LOD, logarithm of the odds; SNP, single nucleotide polymorphism.

