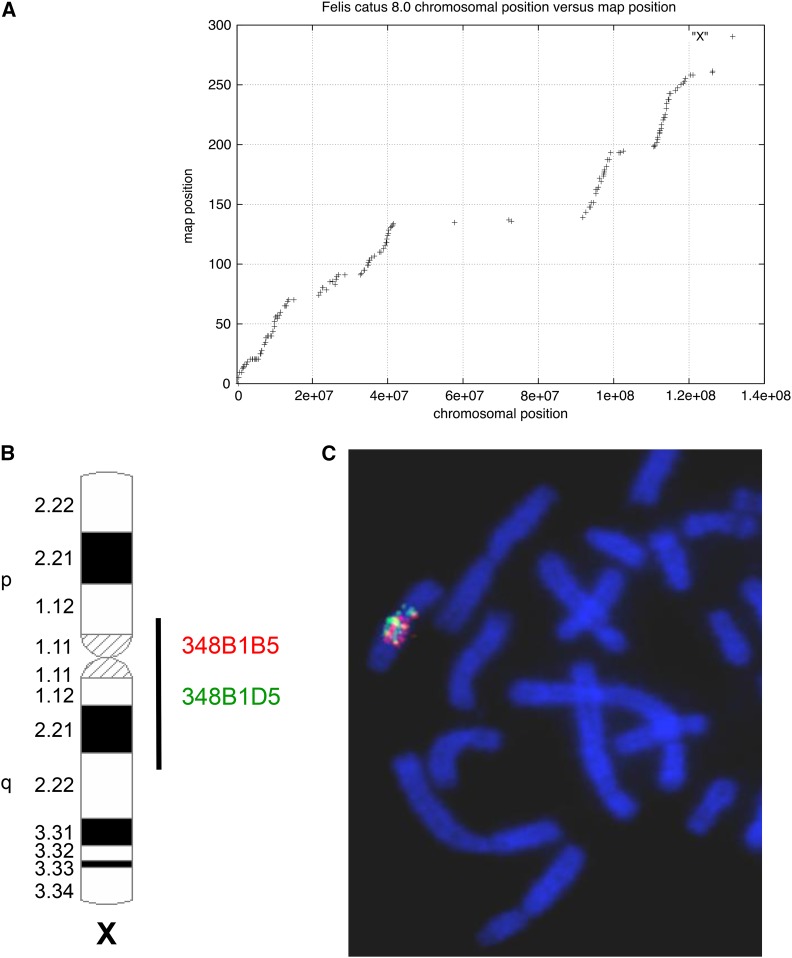
Figure 3.
(A) Plot of recombination distance (y axis, in cM) vs. physical distance (x axis, v8.0 assembly, in bp) for the X chromosome. (B) Ideogram showing the distribution of hybridization signals of two randomly selected domestic cat BAC (bacterial artificial chromosome) clones (from Davis et al. 2009) derived from the centrally located X chromosome recombination desert. (C) Both clones paint the entire chromosomal region corresponding with the approximate boundaries of the recombination desert.

