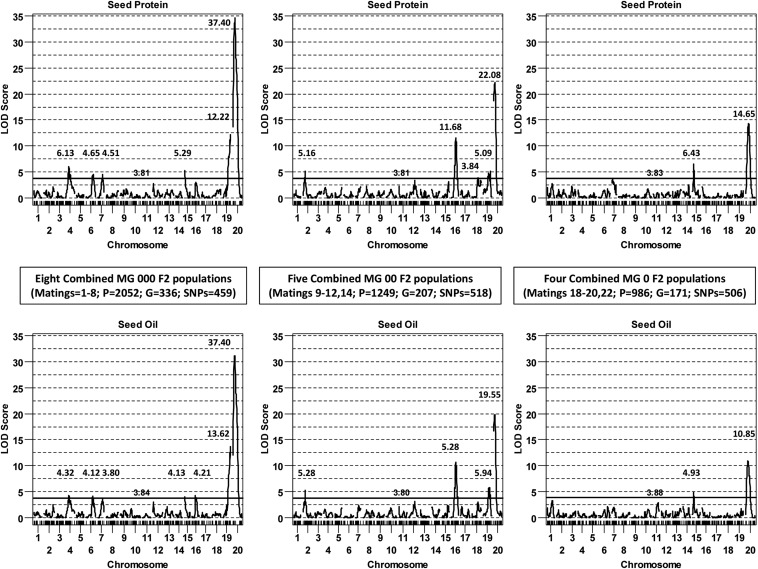
Figure 4.
Chromosomal LOD score scans for protein (top panels) and oil (bottom panels). Selectively genotyped F2 populations derived from parental matings in which the high protein accessions were not unique in terms of SNP genotype were pooled into three MG sets of 000 (left panels), 00 (middle panels), and 0 (right panels). The SG percentages were a respective 16.4, 16.8, and 17.3%, relative to the numbers of phenotypes (P), genotypes (G), and bimorphic SNPs shown for each MG set. Genome-wise α = 0.05 significance thresholds, derived from trait- and population-specific SG-stratified permutation tests (n = 1900), were nearly-identical (i.e., the 3.80 to 3.88 threshold horizontal lines shown in each panel).

