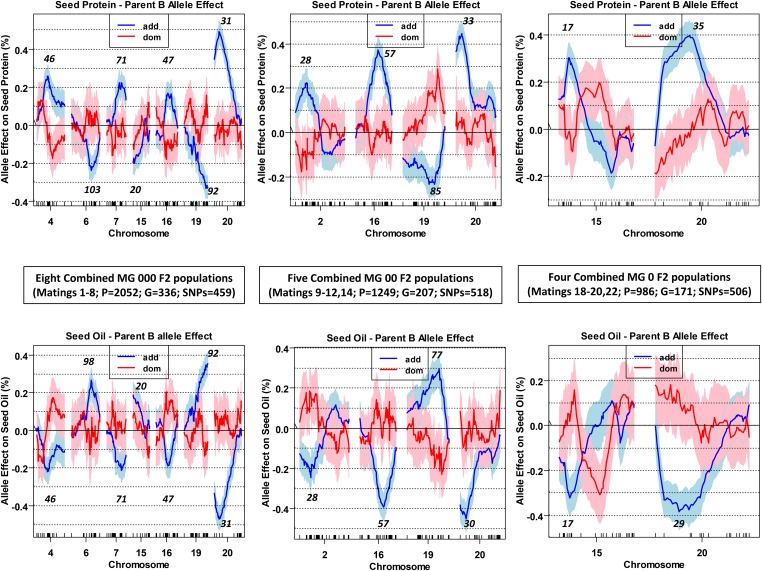
Figure 5.
Chromosomal scans of the estimated additive and dominance effects for protein (top panels) and oil (bottom panels). The scans were limited to just the chromosomes exhibiting LOD score peaks shown in Figure 4. Effect magnitude and direction (+/−) reflect the substitution of a female parent B allele for a male parent A allele at any given bimorphic SNP position, with shading denoting the SE of the effect mean at each SNP. The chromosomal cM positions of the positive and negative additive effect maxima are italicized.

