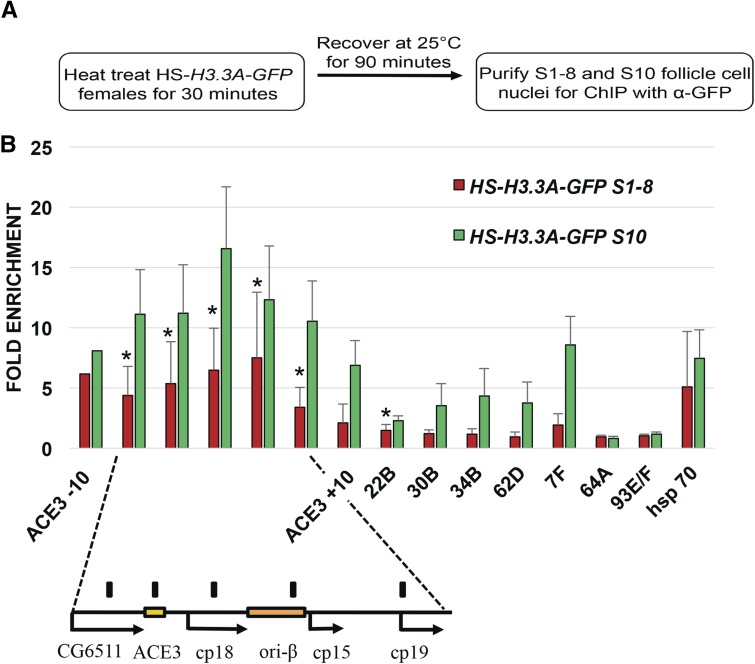
Figure 5.
H3.3 is enriched at amplicon origins in early oogenesis before developmental amplification. (A) Experimental scheme for H3.3A-GFP ChIP-qPCR for stage 1–8 follicle cell nuclei. (B) Anti-GFP ChIP-qPCR analysis of stage 1–8 follicle cell nuclei after heat induction of HS-H3.3A-GFP (red bars). The relative abundance of H3.3A-GFP in stage 10 (green bars), when amplicon origins are active, was assessed in parallel from the same ovary preparations and is replotted from Figure 3B for comparison. During stages 1–8, H3.3A-GFP was significantly enriched at multiple loci across DAFC 66D and at DAFC 22B relative to the two nonorigin control loci 64A and 93E (* P < 0.05, ** P < 0.01 by ratio paired t-test). H3.3A-GFP occupancy was significantly lower during stages 1–8 than stage 10 (see Table S3 for P-values). Values represent average of at least three biological replicates, and error bars represent SD, except for ACE3 –10, which is based on two replicates.

