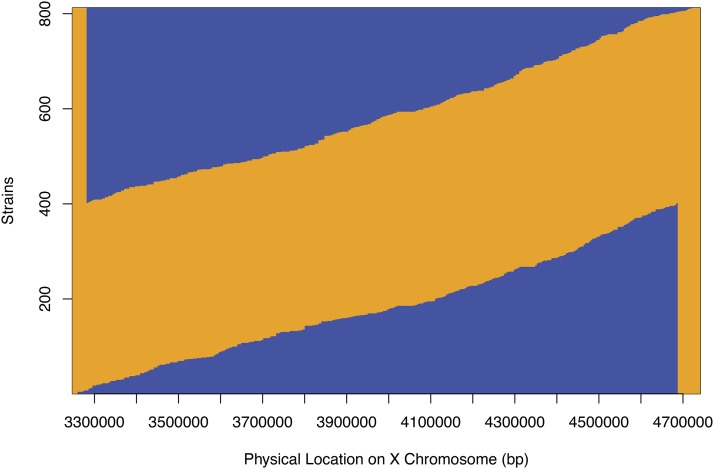
Figure 2.
Genotypes within the focal interval in sub-NILs. Each sub-NIL is illustrated as a horizontal line, where the transition from N2 (orange) to CB4856 (blue) genome, or vice versa, marks the region where the crossover occurred. The “blue triangle” on top encompasses all sub-NILs derived from the LonNIL cross, while the one on the bottom encompasses those derived from the FaxNIL cross. Sub-NILs that are either all N2 or all CB4856 (56 in total) within the focal interval are not shown.

