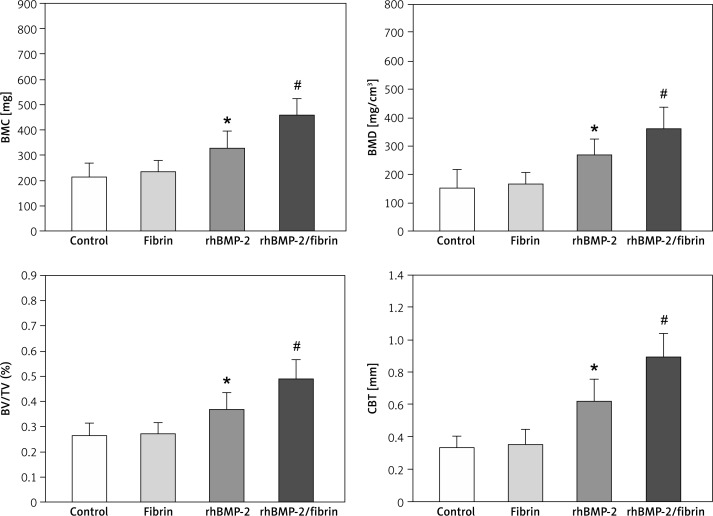
Figure 5.
Results of quantitative micro-CT analysis of the distracted callus 8 weeks after drug treatment
Data are expressed as mean ± SD. *p < 0.05 vs. control and fibrin group, and #p < 0.05 vs. rhBMP-2 group (by one-way ANOVA and Student-Newman-Keuls test, n = 6 specimens in each group). BMC – bone mineral content, BMD – bone mineral density, BV/TV (%) – bone volume fraction, CBT – cortical bone thickness.

