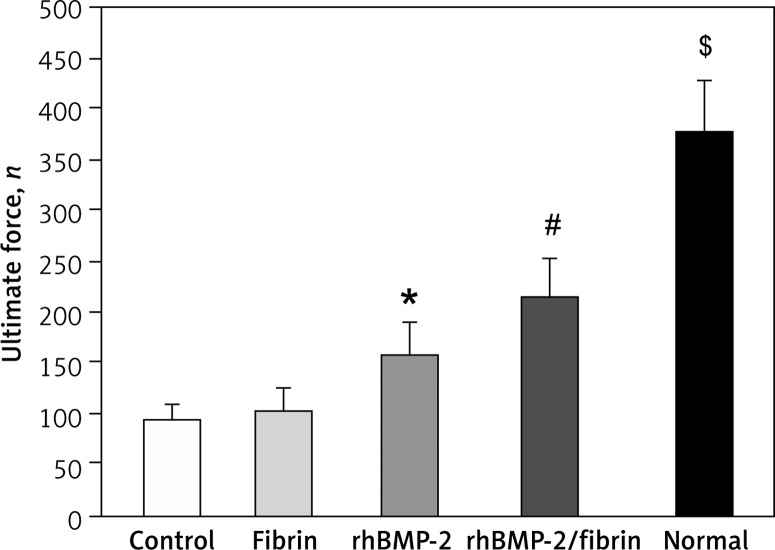
Figure 7.
Ultimate force of the lengthened segments and the contralateral tibiae in the control group 8 weeks after drug treatment were measured by three-point bending test
Data are expressed as mean ± SD; *p < 0.05 vs. control and fibrin group, #p < 0.05 vs. rhBMP-2 group, and $p < 0.05 vs. rhBMP-2 + fibrin group (by one-way ANOVA and Student-Newman-Keuls test, n = 6 specimens in each group).

