
Figure 4.
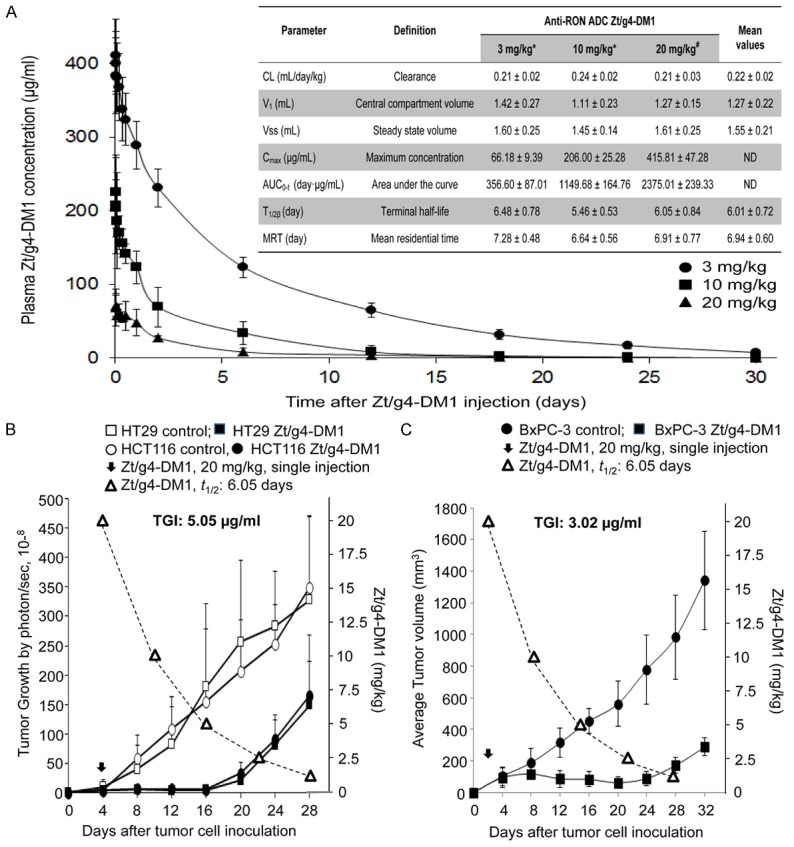
Analysis of pharmacokinetics of Zt/g4-DM1 for predicting the time-dose-relationship: Tumor-bearing and -nonbearing mice (athymic nude, 5 mice per group) were injected with a single dose of Zt/g4-DM1. Collected blood samples were analyzed using the DM1 antibody ELISA kit (Eagle Biosciences, Inc., Nashua, NH) to determine the amount of DM1-coupled Zt/g4 in plasma. Various PK parameters were calculated using the software provided by Eagle Biosciences. (A): PK from both tumor-bearing and nonbearing mice injected with a single dose of 3, 10, and 20/mg/kg Zt/g4-DM1. (B) Dynamics of Zt/g4-DM1 in vivo plotted with the growth curve of CRC xenograft tumors. Athymic nude mice were inoculated with HT29 and HCT116 cells (5 × 10⁶ cells per mouse, five mice per group). A single dose of Zt/g4-DM1 at 20 mg/kg was injected when tumor volume reached ~150 mm3. PK data from (A) was plotted to the tumor growth curve. (C) Dynamics of Zt/g4-DM1 in vivo plotted with the growth curve of BxPC-3 xenograft tumors. Mice bearing BxPC-3 xenograft tumors were injected with a single dose of Zt/g4-DM1 at 20 mg/kg through tail vein when tumor volume reached ~150 mm3. PK data from (A) was plotted to the tumor growth curve. TSCs for CRC and PDAC xenograft models were determined as the minimal dose of Zt/g4-DM1 required to balance tumor growth and inhibition.