
Figure 7.
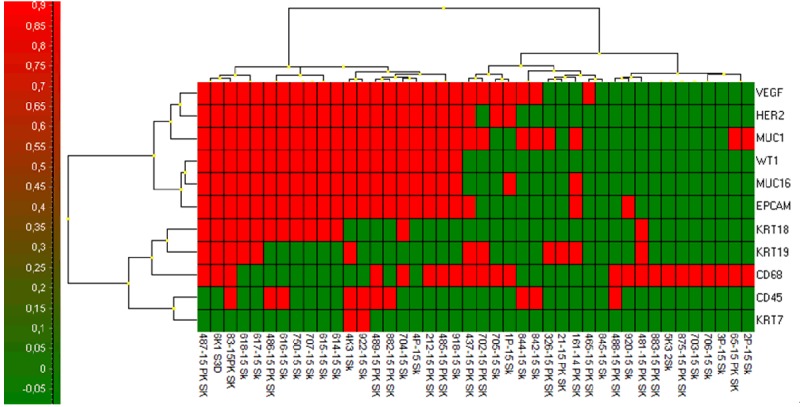
Cluster analysis of gene expression data RNA relative amount (log2) for CTC-membrane fractions (PK SK) of all tested patients clearly identifies CTC-positive and CTC-negative group of patients (Higher expression is shown in red).
Official websites use .gov
A
.gov website belongs to an official
government organization in the United States.
Secure .gov websites use HTTPS
A lock (
) or https:// means you've safely
connected to the .gov website. Share sensitive
information only on official, secure websites.
Cluster analysis of gene expression data RNA relative amount (log2) for CTC-membrane fractions (PK SK) of all tested patients clearly identifies CTC-positive and CTC-negative group of patients (Higher expression is shown in red).