Figure 1.

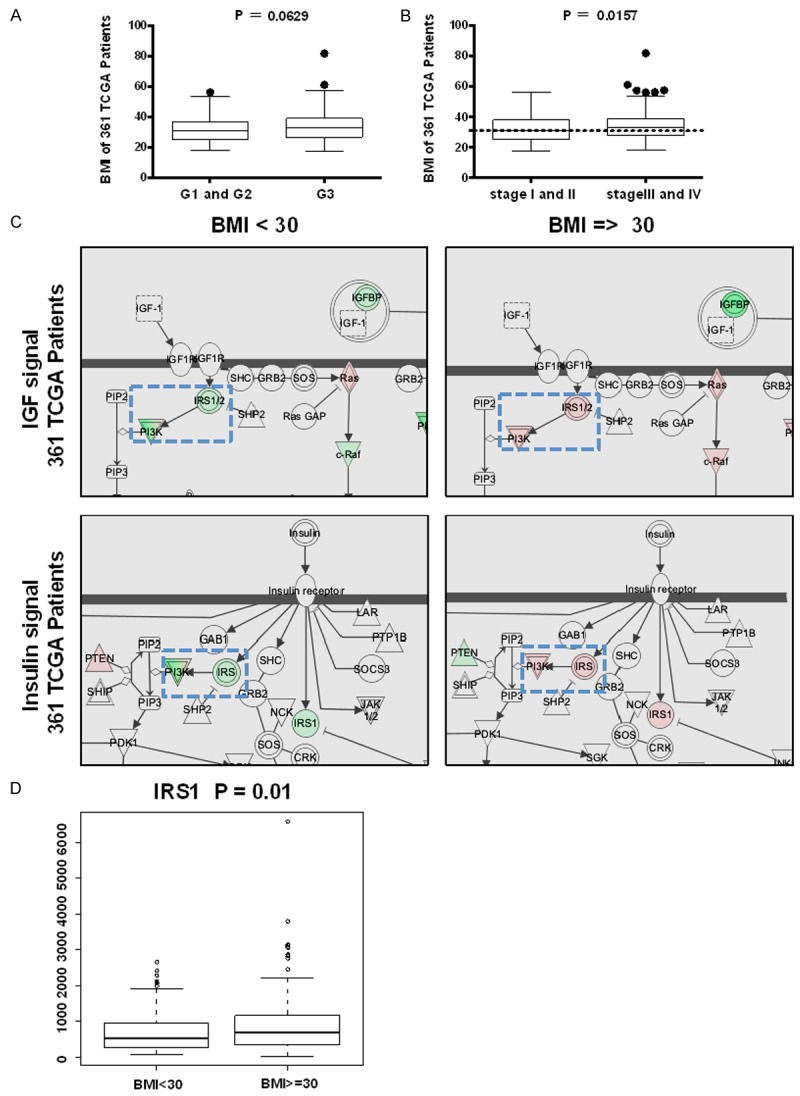
Correlation between BMI and EC grade. Correlation analysis was performed by R language program with 361 EC patients. The clinic data including BMI, Grade, Stage information and RPPA data of 361 EC patients was from the TCGA data on CBio website. Obesityes is a high risk factor of endometrial cancer and associated with insulin resistance closely. A. Grade 1 and 2 (G1 and 2) patients had lower BMI than Grade3 (G3), Unpaired t test (two tailed), P = 0.0629. B. Stage I and II patients had lower BMI than stage III and IV, Unpaired t test (two tailed), P = 0.0157. C. The IGF1 and Insulin signaling network in EC patients with BMI < 30 or EC patients with BMI ≥ 30. In blue frames with dotted line, the patients with BMI < 30 had lower IRS1/2 and PI3K level (light green color), and the patients with BMI ≥ 30 had higher IRS1/2 and PI3K level (light red color). D. The correlation between IRS1 and BMI in 309 of 361 EC patients with mRNA data of Insulin resistant related (IRR) genes. Patients with BMI < 30 had lower IRS1 mRNA level, P = 0.01.
