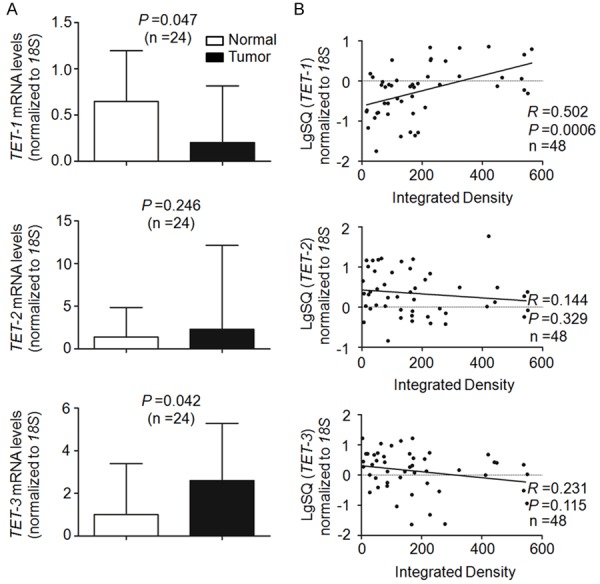
Figure 2.

Association of 5-hmC levels with the expression of TET genes. A. qRT-PCR assay was performed to assess the expression of TET-1, -2 and -3 in LSCCs and match normal tissues. Expression levels of these genes were normalized with 18S rRNA levels. Data were presented as median ± interquartile. B. Linear regression analysis was performed to assess the correlations between 5-hmC levels and mRNA expression of TET-1, -2 and -3 in 24 pairs of LSCC and matched normal tissues. 18S rRNA was used as a normalized control.
