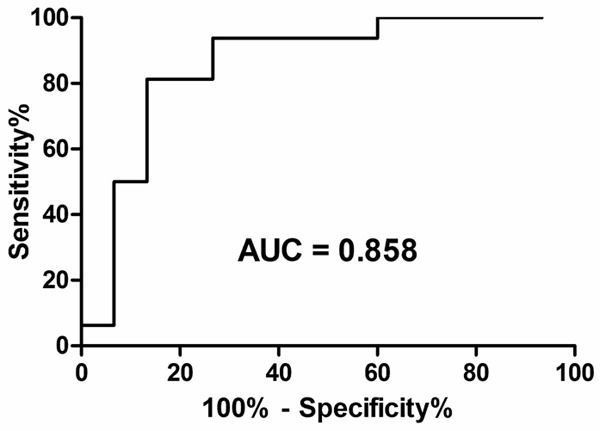
Figure 3.

ROC curve of the relative mRNA level of MLH1 in distinguishing HNPCC family members with or without MLH1 or MSH2 mutation. The relative mRNA level of MLH1 was a significant predictor of HNPCC status (cut off: 0.511; Sensitivity: 81.3%, Specificity: 86.7%. AUC = 0.858; P < 0.001).
