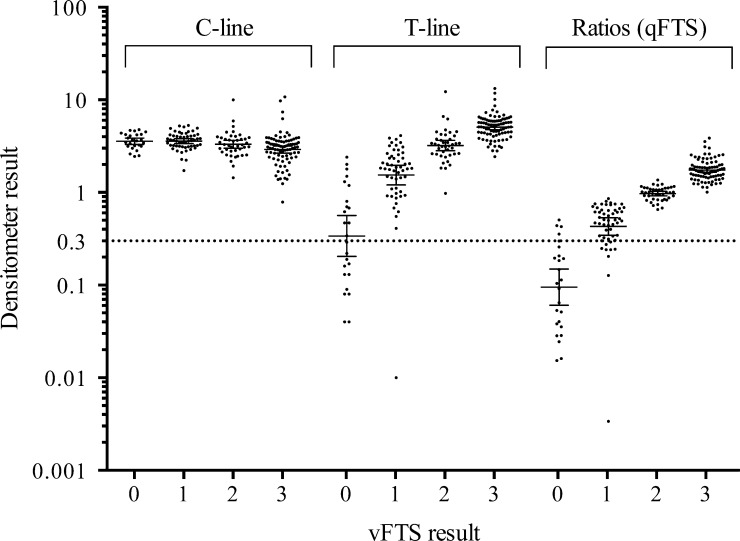
Figure 1.
Distribution of the densitometer results for the control line (C-line), the test line (T-line), and the T/C ratios (quantitative Filariasis Test Strip [qFTS]) according to visual Filariasis Test Strip (vFTS) results. The optimal cutoff for positivity of qFTS was determined to be 0.30 (dotted line) using receiver operating characteristic analysis and vFTS results as reference standard. Solid horizontal lines represent geometric means and 95% confidence intervals.

