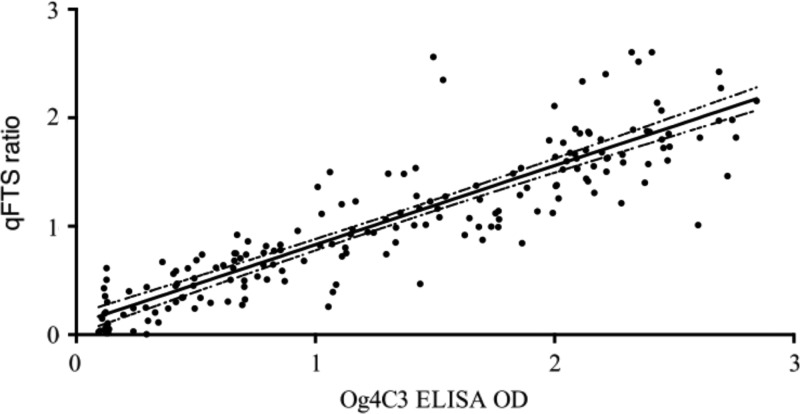
Figure 3.
Relationship between qFTS ratios and Og4C3 ELISA OD values for all samples tested by both methods (Spearman's rank correlation coefficient ρ = 0.91, P < 0.001) with a fitted regression line and 95% confidence intervals. ELISA = enzyme-linked immunosorbent assay; OD = optical density; qFTS = quantitative Filariasis Test Strip.

