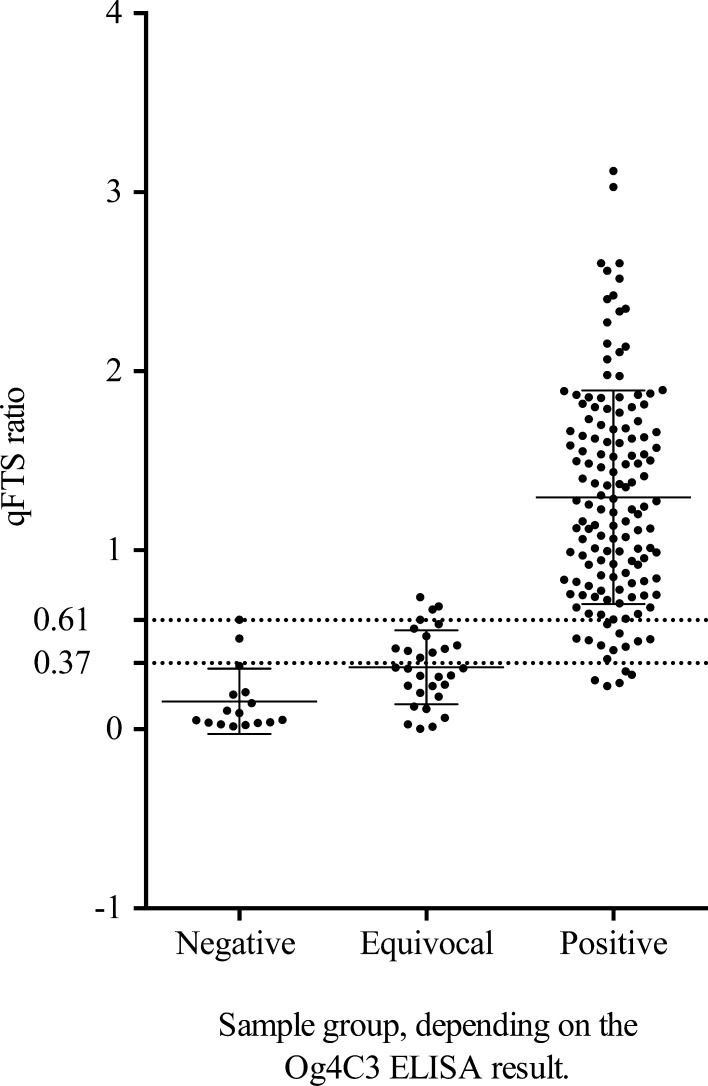
Figure 4.
qFTS ratios of individuals that tested negative (OD < S2), equivocal (S2 < OD < S3), or positive (OD > S3) for circulating filarial antigen (CFA) by Og4C3 ELISA. The dotted lines represent the optimal cutoff values determined by receiver operating characteristic analysis when only the negative group was considered negative (cutoff = 0.37) or when both the negative and equivocal groups were considered to be negative for CFA (cutoff = 0.61). Solid horizontal lines represent geometric means and 95% confidence intervals. ELISA = enzyme-linked immunosorbent assay; OD = optical density; qFTS = quantitative Filariasis Test Strip.

