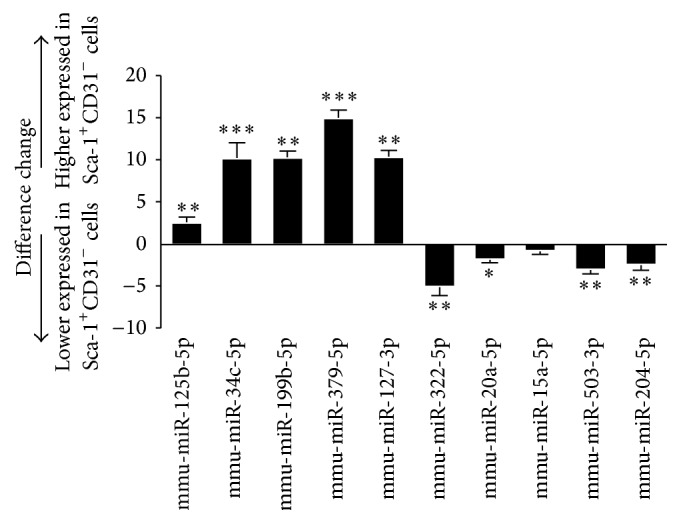
Figure 4.

Expression profiles of miRNAs detected by dd-PCR. Bars: changes in miRNAs expression in Sca-1+CD31− cells versus Sca-1+CD31+ cells. Expression was normalized to miRNA U6 and expression change was calculated based on the mean of three biological replicates. Bars above and below the x-axis: upregulated and downregulated miRNAs in Sca-1+CD31− cells. Differences were analyzed with Student's t-test. ∗ P < 0.05, ∗∗ P < 0.01, and ∗∗∗ P < 0.001.
